If you have not already read Parts 1 through 5 of the v-safe saga, please read those first!
Having explained what data v-safe captured and subsequently provided to ICAN in Parts 1 through 5, let’s now get into what the data shows.
Bottom line, and as you will already know from the prior parts, the only check-the-box data that could even potentially raise a safety concern would be a high rate of individuals reporting that they sought medical care after the shot.
This is because the 10 check-the-box symptoms, gathered for seven days after injection, are the same symptoms the CDC say are a good sign after injection because they show the body is developing immunity. That is why the CDC explains that “Any side effects from getting the vaccine are normal signs the body is building protection.” And indeed, when very high rates of these symptoms were reported to v-safe, CDC said there is no cause for concern.
Other than the pointless check-the-box symptom list, the only other check-the-box options a v-safe user could check was if they sought medical care, missed school or work, and/or were unable to perform normal activities.
So, let’s start by looking at the rate of individuals seeking medical care. Note that you can perform the same searches and data mining detailed below at ICAN’s v-safe Dashboard

It would appear safe to assume that the CDC would sound an alarm if there was a high enough rate of people who reported needing medical care. It is, after all, called “v-safe” and was designed to assess safety! But that may be assuming too much.
Let’s do some simple math. Out of a total 10,108,273 users, there were a total of 782,913 registered v-safe users who reported seeking medical care at least once. By simply dividing 782,913 by 10,108,273, we can easily calculate that 7.7% of v-safe users reported having to seek medical care after Covid vaccination.

As a reminder, all indications are that most v-safe users signed up because they were enthusiastic about the vaccine – not because they wanted to report issues. These are the people who were likely to avoid reporting any issue with the vaccine. They were cheering its arrival, being the first to run and get the shot. And still 7.7% reported needing medical care after their vaccination.
(Digging a bit deeper, it is worth noting that there are approximately 528,381 individuals who registered for v-safe but never completed a single health check-in – meaning, they never actually participated in v-safe or submitted health-related data. If we exclude these group, the percent of v-safe users who submitted at least one health check-in and reported seeking medical care was 8.2%. But to be conservative, let’s stick with the 7.7% figure.)
Now, while 782,913 v-safeusers submitted at least one report of seeking medical care, there were a total of 2,108,022 reportsof seeking medical care. This means that, on average, every v-safe user reporting seeking medical care, sought medical care around 2 or 3 times each. Obviously, having to return to the doctor, emergency room, or hospital more than once is not a good sign.
That leads us to the question of what type of medical care v-safe users reported seeking. Just a call to the doctor? Urgent care visit? Trip to the emergency room? Again, the ICAN v-safe Dashboard provides a clear chart:

This data reflects that for all age groups, over 70% sought either urgent, emergency room, or hospital care. What makes this data even more concerning is the fact that not only was it submitted by the vaccine cheerleading crowd, but most check-ins were also submitted between December 2020 and May 2021 when many individuals, especially those freaked out enough about Covid to run and get a vaccine, were reluctant to go to a clinic or hospital due to the pandemic.
Stepping back and thinking about this data as objectively as possible, if you are in the CDC, it would have been fair to assume (i) most folk signing up for v-safe were enthusiastic about the vaccine, (ii) most would be reluctant to report issues with the vaccine, (iii) many would likely not even attribute an issue (especially if occurring two or three weeks after vaccination) to the vaccine unless they had some reason for doing so, for example worsening symptoms. Taking this altogether, with the finding that 7.7% of them reported needing medical care with most of those 7.7% seeking clinical/urgent, emergency, or hospital care, thatshould have beena serious cause for concern.
The CDC, however, was clearly unphased. That is not surprising because just a look at how v-safe was designed reflects that the CDC never intended this system to assess safety but rather intended that it find the vaccines are safe. The proof is in the pudding. A two percent rate of users reporting the need to seek medical care should have been concerning. But when one to three percent (depending on dose, brand, and age) reported medical care in the first week alone, the CDC yawned.
Again, one to three percent (depending on dose, brand, and age) reported seeking medical care within the first week after the shot! That should have made the roof of the CDC explode! But that would not have aligned with the CDC’s policy that the vaccines are safe and its goal of increasing vaccine uptake.
When you then add in the rate of those seeking medical care beyond the first week after the shot, the rate is 7.7% seeking medical care! Seriously, one has to wonder if there wasanyrate at which the CDC would have decided there was a safety concern with these vaccines. After all, the need to seek medical care was the most serious metric it was capturing in the check-the-box data to assess the safety in “v-safe.”
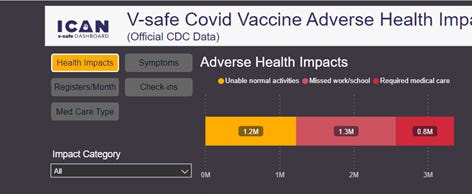
In addition to the 7.7% who reported needing medical care, another 25% reported being unable to perform normal activities and/or missing school or work. That is no small number. For an infection that the CDC’s own data shows is relatively benign for most folks in most age groups, this would appear to be a concerning figure.
Here is a visual of these figures, keeping in mind this chart only counts each v-safe user once. So if a v-safe user reported needing medical care, and also reported missing work, the user would be included in only the medical care category (or the most “severe” category). And a user who reported missing work and being unable to perform daily activities would only be included in the missing work category. (Obviously, someone reporting going to the emergency room or hospital was likely unable to attend work or school and certainly had their normal activities negatively impacted).
These numbers, like the rate of those who had to seek medical care, all of which were hidden from the public until recently,matter. For example, based on CDC policy, the United States military has gone on a crusade demanding every servicemember receive a Covid vaccine and persecutes those who refuse. The military, for its part, argues it cannot have its members out sick with Covid – it needs them in fighting posture.
This is precisely the argument made in the class actions my firm, along with two other firms, brought against the United States Air Force and the United States Army. A federal judge granted a class-wide injunction prohibiting the Air Force from discriminating against its members who refuse the vaccine for religious reasons and an appellate court has affirmed that decision. The Air Force has nonetheless continued to maintain that its needs override these religious beliefs because it has a compelling need to keep its members from missing work days due to Covid.
But the CDC’s own data reflects those members of the Air Force, typically younger and presumably healthier, are at low risk of becoming sick if exposed to SARS-CoV-2 while its v-safe data, finally revealed, indicates these same service members are far more likely to miss work from receipt of a Covid vaccine.
Could this explain why the CDC did not want to disclose the v-safe data? I will leave the speculation to others. The bottom line is that the rate of v-safe users reporting a “health impact,” – the only three CDC chose to collect, and the ones it fought to keep from the public for over a year and a half – is highly troubling and should have caused the CDC to raise immediate alarms about this product.
As noted, v-safe also included a checklist of 10 symptoms for users to select during the 7 days after injection. These symptoms, as discussed previously, were pointless to ask. They were the symptoms CDC says are normal after injection and show the vaccine is “working.” Again, as the CDC explains, “Anyside effects from getting the vaccine are normal signs the body is building protection.”
So, what was the point of these check-the-box symptoms?! The point was plainly to design a system that will show safety, not assess safety.
In any event, let’s see what symptoms were reported. The 10 million v-safe users reported over 71 million symptoms, out of which over 4.1 million were categorized by v-users as severe and 23.3 million as moderate. Users were advised in the app to mark “severe” if their symptoms “make normal daily activities difficult or impossible and “moderate” if their symptoms “limit your normal daily activities.”
Even if 100% of symptoms were reported as severe, would it matter? As it stands, there as an average of over 7 symptoms reported per v-safe user out of a list of only 10 symptoms, with an average of nearly 3 symptoms reported per v-safe user as either moderate or severe. Did that matter?
It should matter. Some of these reported reactions reflect inflammation and an immune reaction in parts of the body where you don’t want this to happen. For example, there were 4 million reports of joint pain, with 1.9 million reported as moderate and over 400,000 reported as severe. Swelling in the joints, especially in the elderly, can be highly concerning. But again, is there a number high enough where it would matter to the CDC? If not, what was the point of collecting this data?
These symptoms also help provide some insight into why v-safe users could not perform normal activities or go to work or school. It also shows the impact on groups that are otherwise at very low risk from SARS-CoV-2, such as infants (under 3 years of age), which reported over 33,000 symptoms among the only 13,963 infants in the v-safe database.
The foregoing provides an overview of the data the CDC choose to collect in the check-the-box fields. If these numbers are not concerning, then what number would be concerning? Is there any number? The CDC designed this system to assess safety, and when it showed high rates of what it chose to collect, that should have caused serious concern.
After all, medical products can cause harm. The fact that this one was showing potential serious widespread harm should not have been surprising. Instead of being transparent, the CDC engaged in the very worst form of conduct. As you will read in the next part of this series, the CDC spent a year providing the public with only a narrow sliver of v-safe data in study after study (the only access the public had at that time to v-safe data) to claim the Covid vaccines are safe while withholding from the public the full dataset which showed the truth.
That is where this story turns from just another story about data reflecting potential serious widespread harm from a pharma product, to one about a far more serious concern. The CDC dissembling to the public exactly what the v-safe data was really showing….
Source: V-Safe Part 6: A First Look at What the V-Safe Check-the-Box Data Reveals!