According toUS News & World Report, Wyoming is the least vaccinated state (52.8%) and Rhode Island is the most vaccinated state.
So just for fun, I thought I’d see how these states fared when there was a huge COVID infection outbreak at the start of 2022 that affected both these states.
It turned out that the least vaccinated state had the lower rise in all-cause mortality (1.25 vs. 1.42) vs. avg mortality for the year.
In other words, vaccination appeared to increase all-cause mortality when COVID hit.
However, it might be the case that Rhode Island simply was “hit harder” by the COVID wave with twice as many COVID infections per capita. Or was Rhode Island hit harder because more people were vaccinated and thus more susceptible to infection which is what the Cleveland Clinic study showed very clearly?
By looking at a younger age group, we see a 3X disparity between the two states. The least vaccinated state came out on top.
We have further, and more conclusive, confirmation from an extensive study done by Josh Stirling. There is simply no way for anyone to explain those results which looked at every county in the US.
The bottom line: higher vaccination —> higher deaths for all age groups. That’s why 15-year-olds with heart attacks are now the new normal when they were non-existent before the vaccines rolled out.
COVID waves are when the CDC would expect the most vaccinated states to do the best compared to the average death rate for the year. So we’d expect a smaller rise in deaths during a COVID infection wave compared to the deaths over the year.
The biggest COVID death peak is at the start of 2022.
So the method is pretty simple: compare the worst four weeks at the start of 2022 with the average death rate for the year in that state. The winner should have the lowest ratio.
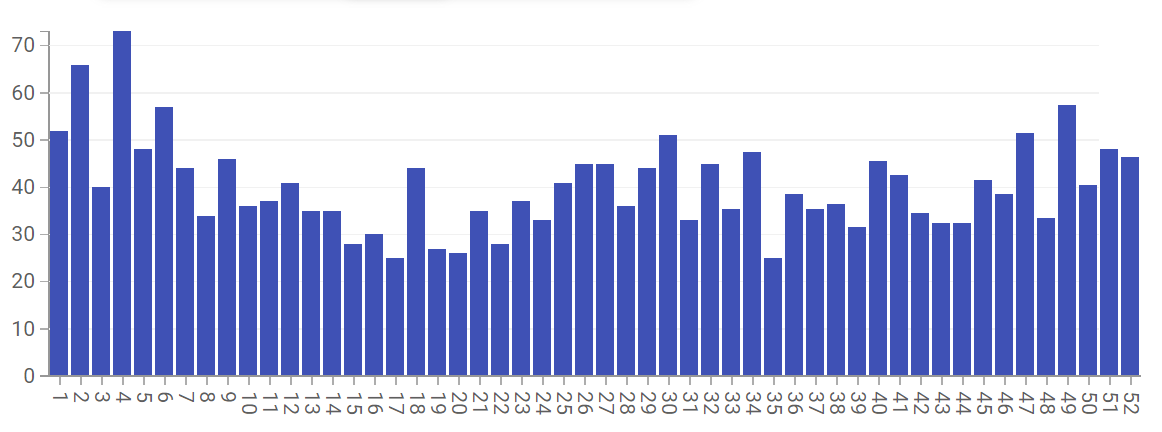
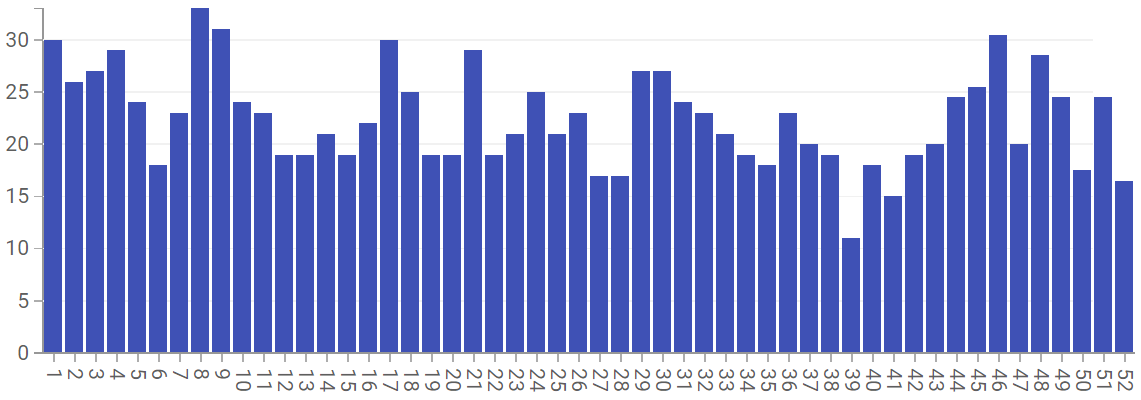
I used the CDC database of weekly deaths by age and stateand the visualization tool on the CDC website.
Worst consecutive 4 weeks are weeks 1-4: (52+66+40+73)/4=57.75 average per week.
Worst 4 week avg/annual avg = 57/40.23=1.42
Worst consecutive 4 weeks are weeks 1-4: (30+26+27+29)/4=28
Worst 4 week avg/annual avg = 28/22.48=1.25
Maybe we just picked the “wrong” age group.
Let’s try the next age group down which is 45-64 over the same “deadly” period.
Weeks 1-4 avg for Wyoming=(24+23+22+16)/4=21.25
Average for 2022=19.25
Ratio: 21.25/19.25= 1.1
Weeks 1-4 avg for Rhode Island: (50+46+44+31)/4=42.75
Avg for 2022=32.6
Ratio: 42.75/32.6=1.31
Again, Wyoming had the smaller spike among that age group.
The only way for a pro-vaxxer to attack this result is to claim that Rhode Island had a COVID infection wave in January 2022, but Wyoming missed the wave.
Let’s check that out…
These are the COVID cases for Rhode Island:
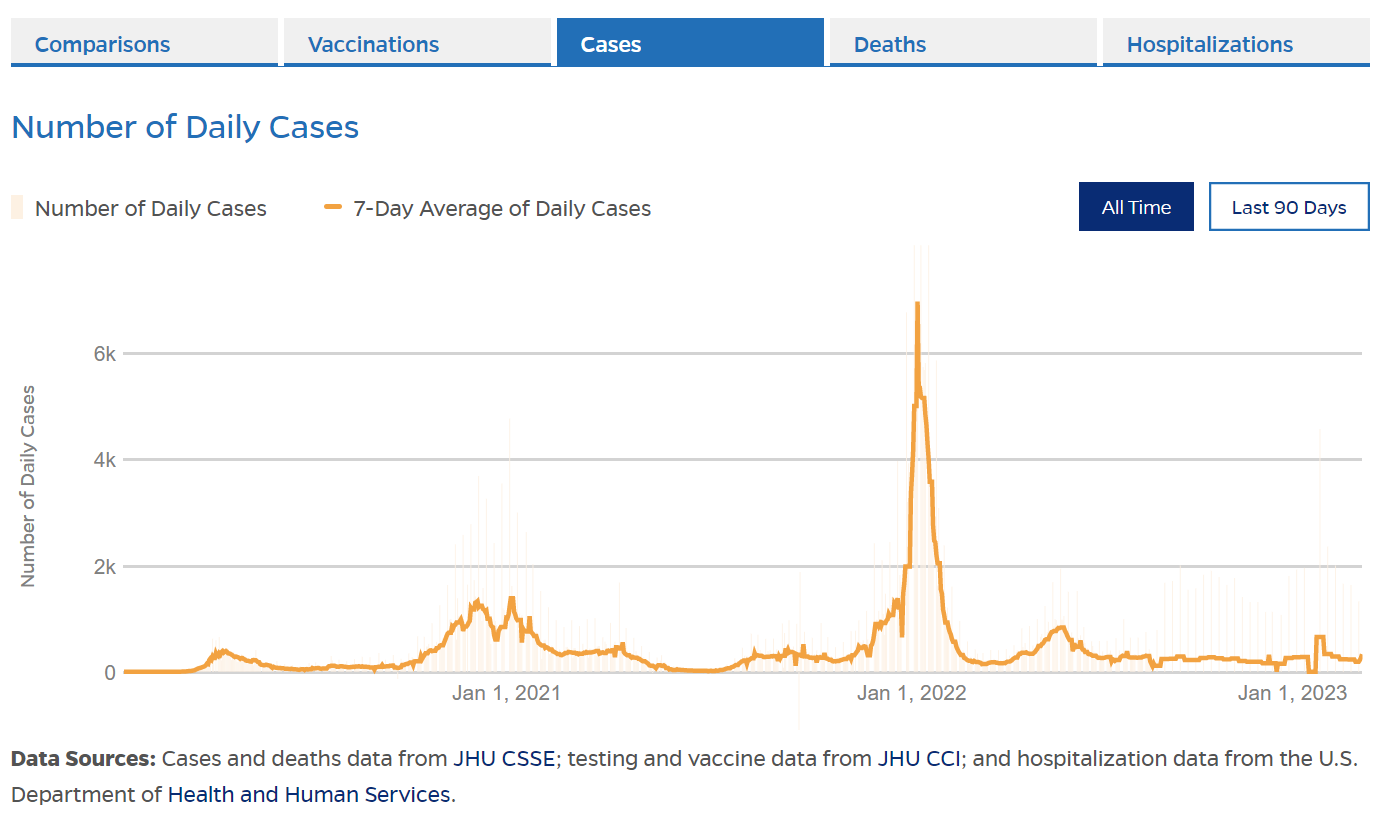
Here are the COVID cases for Wyoming:

So it was a fair test. Both states had their largest COVID peaks in January. So that was fair.
However, you could also argue that Rhode Island was “harder hit” by the COVID wave than Wyoming and that accounts for the greater all-cause mortality.
Let’s see if that is true.
The population is 1.1M in Rhode Island vs 578K Wyoming, so Rhode Island is 1.9X larger, but they had 4X as many cases!
So for the 65-74 year old age group, the most vaccinated state did slightly better since it was hit harder than the ratios could account for! But see the next section…
However, when we look at the 45-64 year age group, we have a spike that is 3X higher in Rhode Island. That’s hard to explain since there is only a 2X per capita increase in cases.
Is the reason Rhode Island was hit harder on a per capita basis because they were more vaccinated? The Cleveland Clinic study showed that people who vaccinate more are more likely to get COVID. If that is true, then the winner is Wyoming.
For some insights into this, look at the ratio between the pre-vax peak in Wyoming vs. the peak around Jan 2022… it’s only about 50% higher. But the pre-vax vs. post-vax peak in Rhode Island is more than 4X higher!!! Did Rhode Island simply get unlucky and have an 8-fold increase (=4/.5) in the relative sizes of the COVID infection peaks?
I looked at the next two states on the list: Alabama (least vaccinated) and Vermont (most vaccinated). I compared the pre-vax and post-vax peaks and found the same ratio! The higher vaxxed state had a greater infection ratio pre- vs. post-vax (2564/248=10.3X) than the less vaxxed state (17106/4221=4.05).
Isn’t that interesting? In short, it appears the more vaccinated the state, the greater the COVID infection rate on a per capita basis.
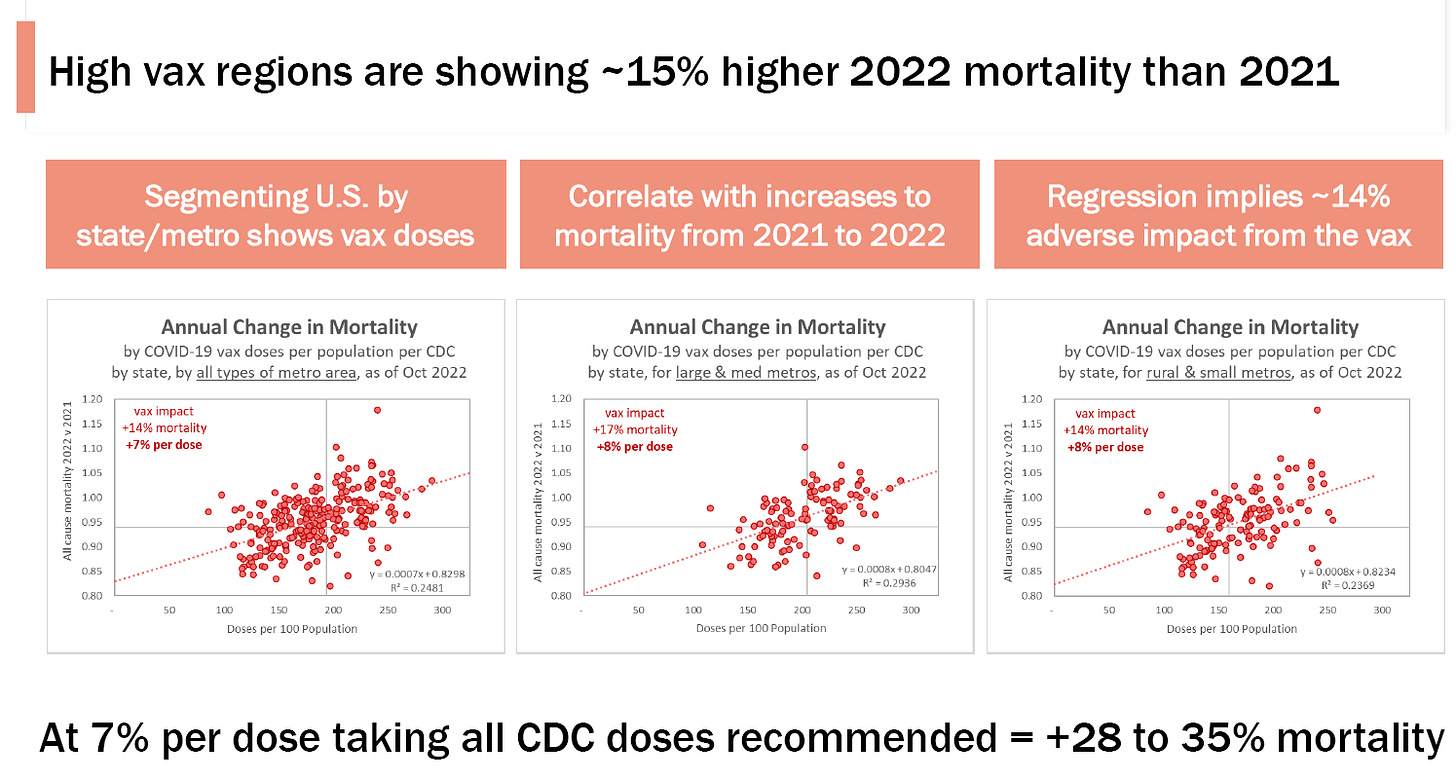
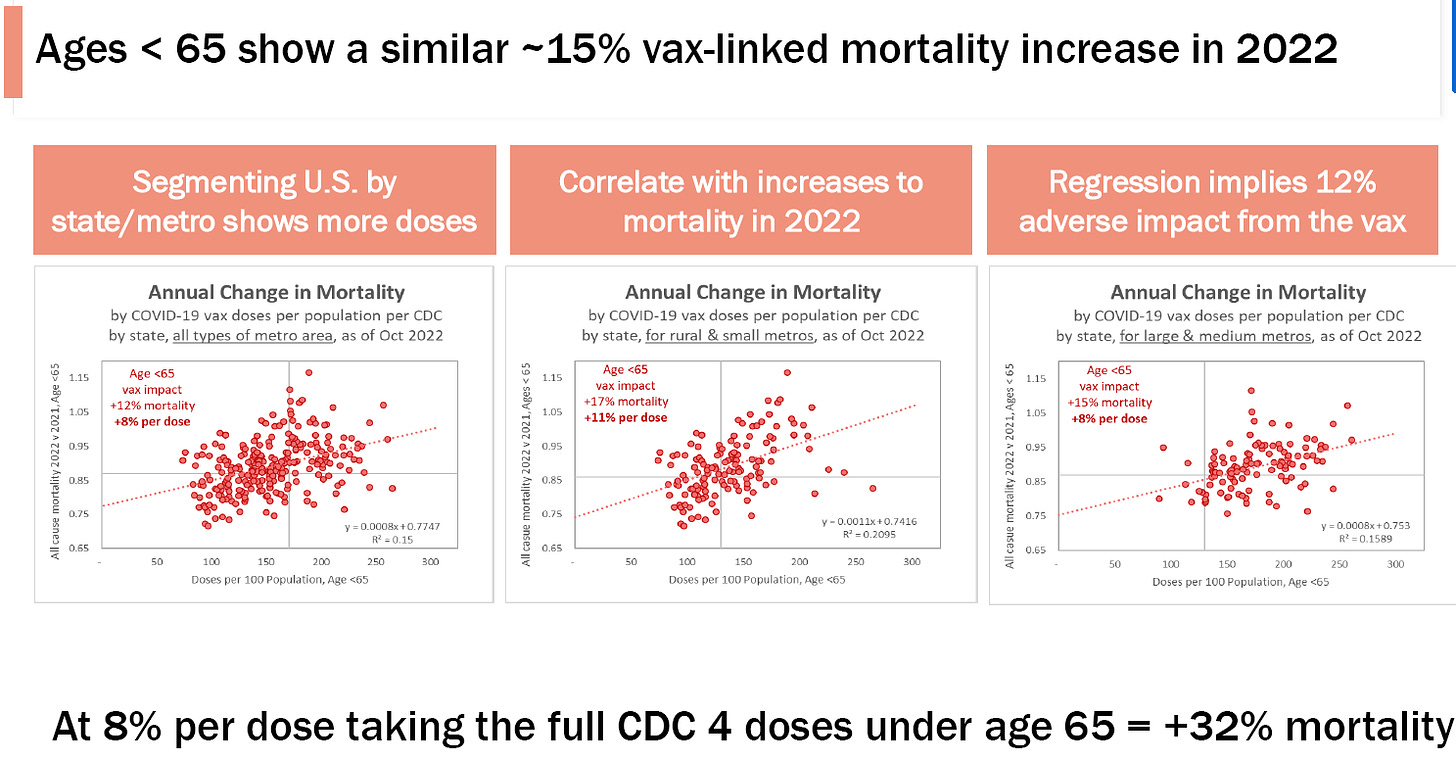
Josh Stirling looked at how cities in the US did in 2022 vs. 2021. He did a longitudinal study where you compare the city with itself one year ago. This is the best way to see what is going on… did your mortality increase or decrease?
Check this out: cities with higher vaccination had larger all-cause mortality increases than cities with lower vaccination rates.
In other words, the line goes the “wrong way.”
This is devastating for the narrative, but of course consistent with what the death reports are saying.
The R2 doesn’t need to be .9 for this to be convincing. They are correlated and it’s the slope of the line that is significant. The slope goes the wrong way. That’s the point.
Could someone argue that this could be caused by other factors? Sure.
But this result is consistent with other analyses, such as theDevil’s Advocate global analysisby Martin Neil and Norman Fenton showing a similar effect (though not longitudinal).
And how is anyone going to explain why we can’t seem to find any nursing home where the death rates went DOWN after the vaccine program was rolled out?
For example, I know one nursing home in Melbourne, Australia with around 90 people who had close to 30 deaths within 12 monthsafter the vaccines rolled out. So we know it wasn’t COVID that killed people in such huge numbers since they were all vaccinated. So I wonder how they died? I have a video of their death announcements.
Check out my survey results for nursing homes and my Medical Practice stats, especially the comments. If the vaccine is safe and effective, these results and comments are hard to explain, aren’t they?
Finally, a large geriatric practice (around 1,000 patients, 75% over 65, had just 4 COVID deaths (vaccinated) and 1 COVID death (unvaxxed). Population was 85% vaxxed. More important was that in 2022, instead of the normal 11 deaths, they had 39 deaths. They attributed the excess to the vaccine. So it would be difficult for anyone to explain that data. But I’m open to hearing it!

If the vaccine really worked, the state with the lowest vaccination rate should have the highest spike in all-cause mortality during a COVID wave. That wasn’t the case for the 45-64 age group and it’s arguably not true for the 65-74 age group if you believe that the higher cases are due to higher vaccination rates.
Josh Stirling’s analysis of all cities in the US makes it clear that it’s more likely than not that the vaccines have resulted in a net increase in deaths and thus were a very dumb intervention.
Source: Most vs. least vaccinated states: Can you guess which did better when COVID broke out?